Blitz:Debugger
Blitz Basic / AmiBlitz comes with a runtime debugger that can be used to help find problems occurring while your program runs. Enabling the debugger will cause your code to run more slowly, but in most cases the debugger will stop the code before it does anything that causes a crash. It will also show you the offending code and a brief description of the error.
Original Blitz Basic 2.1 has a simple debugger included which is fine for running on unexpanded Amigas where RAM is limited to a couple of megabytes. But if you have a more modern setup, the newer AmiBlitz has a much improved debugger. If you still use Blitz 2.1 with an expanded Amiga, you can download the Blitz Support Suite which contains the updated debugger, as well as an improved editor, expanded libraries and other improvements.
Contents
Starting the Debugger
The debugger is run automatically by Blitz when you select the Compile & Run option from the Compiler menu and have the debugger enabled. To enable it, you can enter the Compiler Options window from the Compiler menu. There you will find an option to enable the runtime error debugger, along with some options on what the debugger checks. Please note that code will run much more slowly with the debugger active than it would normally.
Debugger Windows
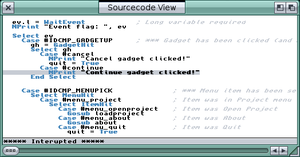
The debugger will open its windows on the Workbench screen when your program is running. The main control window simply contains a row of gadgets which are used to control the debugger. The source window shows the current line of the source code, and the code nearby. Other windows need to be opened manually, either by clicking the relevant gadget in the control window, or by selecting the window from the debugger's menus.
This article is based on the Amiblitz 3 debugger. The basic debugger from Blitz 2 doesn't support some of the functionality and will look slightly different, but the basics are the same.
The Control Window
This window is used to control the debugger, and is the main debugger window. closing this window will halt your program and return you to Blitz. The title bar of this window shows the program's current mode, either Amiga, QAmiga or Blitz.
The gadgets have the following functions (keyboard shortcuts are shown in brackets):
- STOP
- Stop. Halts the current program flow and displays the instruction about to be executed in the source window. Only effective if the program isn't sleeping.
- STEP
- Step. When program flow is stopped, this executes the single instruction that is highlighted in the source window and moves the highlight to the next instruction waiting to be executed.
- SKIP
- Skip. When program flow is halted, this skips the currently highlighted instruction without executing it, and moves the highlight to the next instruction waiting to be executed.
- TRACE
- Trace. This sets the program flow running, but still highlights each instruction as it is executed in the source window. It allows variables to be traced in real-time as the program runs, however program execution is very slow in this mode.
- RUN
- Run. Sets the code running at normal speed again.
- <
- Step backwards. When program flow is stopped, this gadget allows you to retrace the steps the program flow took
- >
- Step forwards. When program flow has stopped and the steps have been retraced with the step backwards gadget, this button will step forwards again towards the current point in the program. You can't step past the current point (use STEP for that).
- EXEC
- Execute. This allows the user to enter a Blitz command to be executed immediately when the program flow is stopped. Similar to Direct Mode of other BASICs.
- EVAL
- Evaluate. This displays the current value of a variable or expression entered by the user. It is possible to enter full expressions as well as array references here, for example myarray(x, y) will display the value stored in myarray() at the location determined by the x and y variables.
- BLTZ
- Shows the current Blitz mode display. Click the mouse again to return to the normal Amiga display.
- REG
- Registers. Displays the contents of the CPU registers. This only works when running natively on a 68k CPU so is disabled under OS4 and MorphOS.
- MEM1
- Memory Window 1. Opens a window to monitor the contents of a portion of RAM. Again, disabled under OS4 and MorphOS.
- MEM2
- Memory Window 2. Opens a second window to monitor another portion of RAM. Disabled under OS4 and MorphOS.
- VAR
- Variable Trace. Opens a window showing the contents of variables set up to be traced. See below for more details.
- ASM
- Assembly. Shows a disassembly of the 68k code currently running. Disabled under OS4 and MorphOS.
- COP
- Copper. Shows a disassembly of the copper instructions currently running. Disabled under OS4 and MorphOS.
- GS
- Gosub Step. Toggle this gadget on to skip debug tracing or single stepping for Gosub subroutines. Tracing will continue when program flow returns from the subroutine. If left off, all commands in the subroutines will be traced or stepped through.
- PS
- Procedure Step. Toggle this gadget on to skip debug tracing or single stepping for procedures (functions and statements). Tracing will continue when program flow returns from the procedure. If left off, all commands in the procedures will be traced or stepped through. Handy for skipping the procedures used from Include files.
- BC
- Blitz Control. Toggle this gadget on to disable the Blitz mode screen updates when tracing or stepping.
Source Window
This window starts empty, but when program flow is stopped it shows the current position in your source by highlighting the instruction that is about to be executed. If program flow has stopped because of an error, the error description will be shown at the bottom of this window. Click on a variable name in the source window to show the current contents of that variable, along with other information, such as the variable's address. This will only work if the variable is not involved with the current instruction, so you may have to click on a previous mention of the variable to show the information.
Variable Trace Window
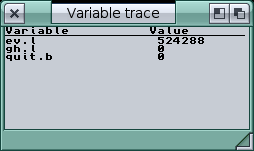
The variable trace window lists any variables set up to be traced, along with their current values. Like the source window, it is only updated when the program flow is stopped, tracing or being single stepped manually. To add a variable to the trace, select Add Trace... from the debugger's menus, enter the name of the variable and select the type of variable it is. You can only add variables that have already been declared by your program, so you need to stop program flow after they have been initialised.
By default, variable contents are displayed in decimal format. To display in hex instead, put a $ character before the variable name in the requester. And to display in binary, put a % character before the name.
Note: Be careful with the values shown as shorter numbers do not blank the extra digits of longer numbers. For example, the ev.l variable in this screenshot is currently 524288. If it is changed to contain the value 8 instead, the trace window will look like it is 824288 as only the first digit is overwritten!
Register Window
The register window will show you the contents of all the 68k address and data registers, as well as the memory contents at the locations pointed to by the address registers. It also shows the various status registers. Register values can be modified by clicking on them and entering new values. Only for people who really know what they're doing!!
Memory Windows
The memory windows allow you to see the contents of memory at a specific address, as well as nearby addresses. The contents are shown both in hex and ASCII. Scrolling through memory is possible with the arrow keys, and the windows can be enlarged to show more addresses. It is also possible to modify the memory contents by clicking on the location and typing in a new value. Again, only for people who really know what they're doing!!
Object Trace Windows
These windows can be opened to display the contents of the structures associated with various Blitz objects. To open a window, select the relevant object type from the menu. This will show the object of the chosen type with ID 0; other IDs can be selected using the slider in the window. Up to 10 object windows can be opened at once.
Array Trace Window
This window will show the contents of any 1- or 2-dimensional array of integers. Enter the name of the array to be displayed and the contents will be laid out appropriately in this window, complete with indices. Like other trace windows, this will only update when in stopped, trace or stepping mode.


